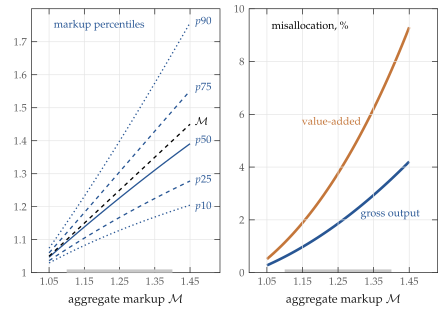
 Figure 1. Markup Distribution and Misallocation in Benchmark Model
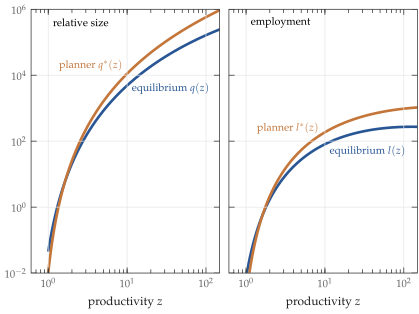 Figure 2. Equilibrium and Planner Allocations
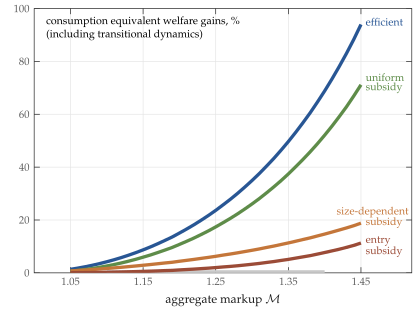 Figure 3. Welfare Gains from Alternative Policies
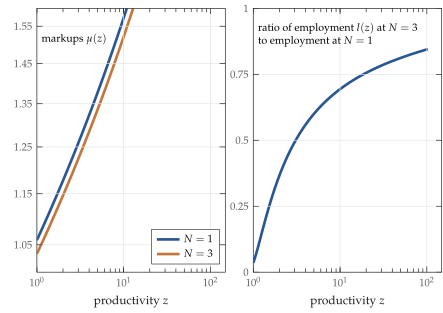 Figure 5. Effect of Entry Subsidy on Markups, \(\mathcal{M}=1.15\)
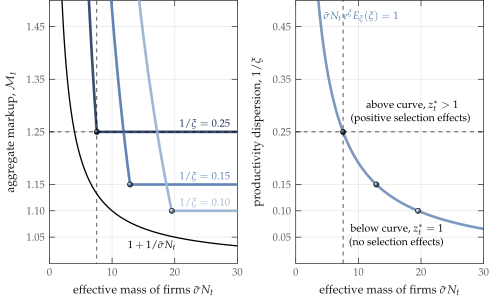 Figure 6. Aggregate Markup with Translog Demand
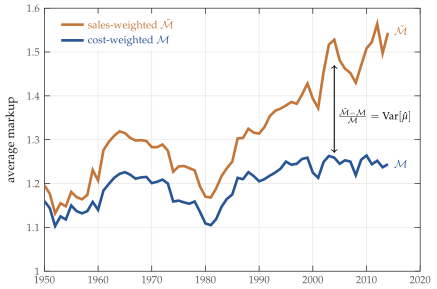 Figure A1. Cost-Weighted vs. Sales-Weighted Average Markups, Compustat interactive
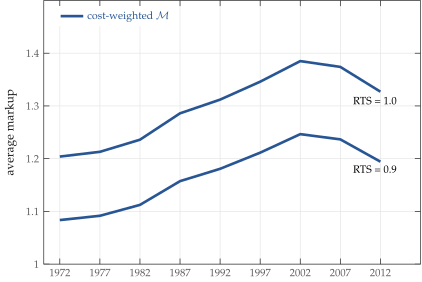 Figure B1. Aggregate Markup from Census Data
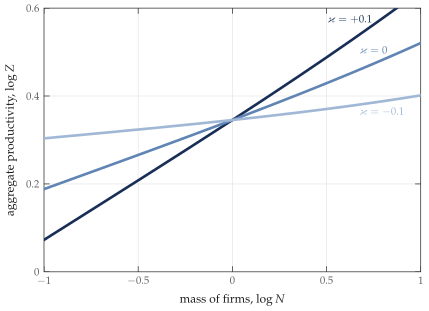 Figure I1. Love For Variety Effects
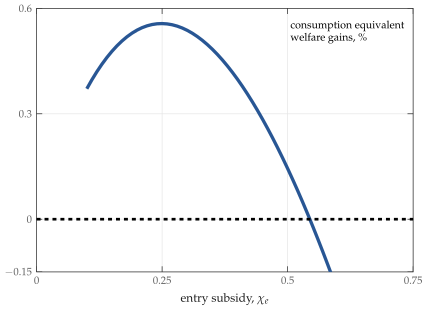 Figure 4. Optimal Entry Subsidy, \(\mathcal{M}=1.15\)