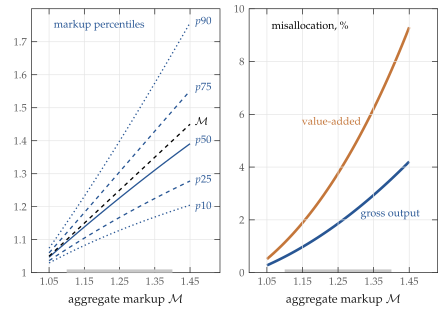
Left panel shows cost-weighted steady-state markup distribution in our benchmark model with monopolistic competition and Kimball demand for a range of targets for the aggregate markup \(\mathcal{M}\). For each \(\mathcal{M}\) we recalibrate the Pareto tail \(\xi\), demand elasticity \(\bar{\sigma}\), super-elasticity \(\varepsilon/\bar{\sigma}\) and weight on value-added \(\phi\) to match the calibration targets in Table 1. Right panel shows implied amounts of misallocation in aggregate gross output and aggregate value-added. To isolate the effect of misallocation on value-added aggregate productivity we report the value-added aggregate productivity loss with the same amount of markup dispersion but holding \(\mathcal{M}=1\) to eliminate the distortion between value-added and materials, see text for details. Shaded interval indicates range of \(\mathcal{M}\) implied by the US Census of Manufactures from \(1972\) to \(2012\), as discussed in Appendix B.
In the paper: Figure 1. Markup Distribution and Misallocation in Benchmark Model.