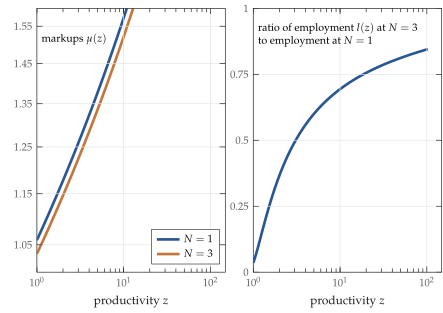
The left panel shows steady-state markups \(\mu(z)\) for an economy with mass of firms \(N=1\) and an entry subsidy chosen to triple the mass of firms to \(N=3\). The right panel shows the ratio of employment \(l(z)\) at \(N=3\) to employment at \(N=1\). Small, low markup firms contract by more than large, high markup firms so that high markup firms get relatively more weight in the aggregate markup calculation. Because of this, the aggregate markup hardly changes. In this example, the aggregate markup barely changes, from \(\mathcal{M}=1.150\) to \(\mathcal{M}=1.146\), even though the mass of firms triples.
In the paper: Figure 5. Effect of Entry Subsidy on Markups, \(\mathcal{M}=1.15\).