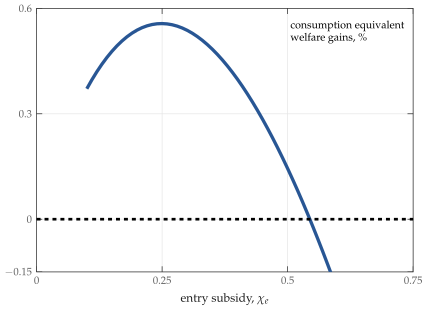
Consumption equivalent welfare gains (including transitional dynamics) as a function of the entry subsidy \(\chi_e\) for aggregate markup \(\mathcal{M}=1.15\). The welfare gains for entry subsidies reported in Table 4 are for the optimal entry subsidies, i.e., for the peak of such curves for each \(\mathcal{M}\). In our benchmark calibration there is insufficient entry in the initial distorted steady state so the optimal entry subsidy is positive. But entry subsidies that are too large lead to welfare losses.
In the paper: Figure 4. Optimal Entry Subsidy, \(\mathcal{M}=1.15\).