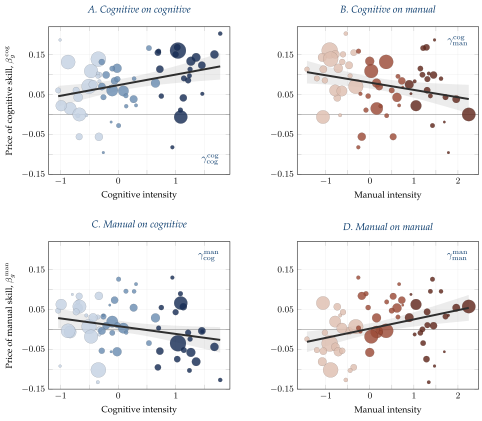
Each point is an occupation group \(g\). The vertical axis is the estimated price of cognitive skill, \(\beta_g^{\rm cog}\) (top row), or of manual skill, \(\beta_g^{\rm man}\) (bottom row), estimated from the worker-level regression (46) with controls for education, experience, sex, race, hours, and fixed effects for each detailed three-digit occupation within group \(g\). Cognitive and manual skill are measured by the worker’s AFQT score and a manual ASVAB composite respectively. The horizontal axis is the group’s mean cognitive (left column) or manual (right column) task intensity, standardized across groups. Marker area is proportional to the number of person-years in group \(g\), and marker color indicates terciles of the task intensity on the horizontal axis. The solid line is the weighted least-squares fit of the gradient (47). The shaded region is the pointwise 95% confidence band for the fit. The gradient and its bootstrap standard error for each panel are reported in Table 2. NLSY79, 1980–2022; \(G=63\) two-digit occupation groups; 128,246 person-year observations.
In the paper: Figure 10. Skill prices across occupation groups in the NLSY79.