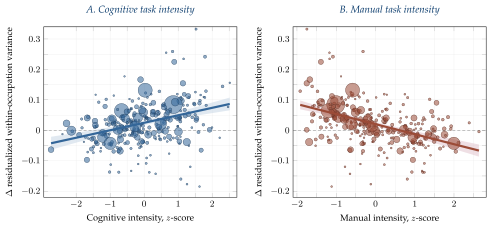
Each point is a three-digit occupation. The vertical axis is the change from 1980 to 2010 in the within-occupation variance of residual log wages with occupation-specific controls for gender, race and hours, as in column 4 of Table 1. Panel A plots this change against the occupation’s cognitive task intensity, Panel B against its manual task intensity, both from Autor and Dorn (2013). Marker area is proportional to 1980 occupation sample size; the solid line is a weighted least-squares fit with its \(95\%\) confidence band. One occupation, farmers, lies below the frame with a change of \(-0.47\); it accounts for \(0.2\%\) of employment and is retained in the estimation. Census 1980 and ACS 2010, \(J = 286\) occupations observed in both years with valid task intensity scores. See Appendix B.1 for more details.
In the paper: Figure 1. Changes in within-occupation inequality by task intensity, 1980 to 2010.