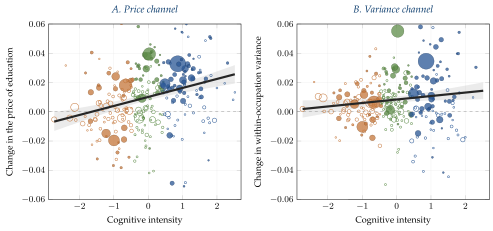
Each point is a three-digit occupation, plotted against the occupation’s Autor and Dorn (2013) measure of cognitive task intensity. Panel A plots the 1980–2010 change in the within-occupation price of education \(\beta_{j}^{\rm edu}\). Panel B plots the change in the within-occupation variance \(V_{j}\). The weighted fits have gradients \(+0.0061\) (standard error \(0.0011\)) and \(+0.0024\) (standard error \(0.0012\)) respectively. Markers are solid where the change in the price of education is statistically significant, \(|z_j|>2\) and hollow otherwise. Marker color indicates terciles of cognitive task intensity (low, orange; middle, green; high, blue) and marker area is proportional to 1980 employment. The shaded regions are pointwise \(95\%\) confidence bands. The observations outside the frame account for \(0.2\%\) of employment in Panel A (5 occupations) and \(0.3\%\) in Panel B (9 occupations). All occupations are retained in the regressions. Census 1980 and ACS 2010, \(J = 286\) three-digit occupations observed in both years.
In the paper: Figure B.1. The two dimensions of displacement, 1980 to 2010.